from matplotlib import pyplot as plt
%matplotlib inline


def model(previous, k, capacity):
    return previous + k*previous * (capacity - previous)

def yeast_mass(n, k=0.00082, capacity=665):
    yeast = [9.6]
    for i in range(n):
        yeast.append(model(yeast[-1], k, capacity))
    return yeast

def saveplot(massdata):
    fig, ax = plt.subplots(figsize=(7,7))
    ax.plot(massdata, "xb") # your may change
    ax.set_xlabel("Time") # x label change
    ax.set_ylabel("Yeast Biomass") #
    ax.set_title("Yeast Biomass Estimation")
    ax.legend()
    ax.grid(True, alpha=0.3)
    fig.tight_layout()
fig.savefig("yeast.png", dpi=150)Module III - Day 4
Python Made Easy: Science and Math Edition
Sep-Dec 2025 batch, Vikrant Patil
Date: 28th Feb 2026
Live note are here https://vikrant.dev/python-made-easy-science-math/students-module3-day4.html
Please login to https://traininghub.vikrant.dev and create a notebook with name module3-day4.ipynb
© Vikrant Patil
Mathematical Modeling
Growth of a Yeast Culture
Suppose we start with some culture of yeast bacterias in milk/medium. So we want to observer how much yeast bomass is present at given time frame. So we take observans each hour.
| Time in hours (n) | Yeast Biomass (Pn) | Change (Pn+1 - Pn) |
|---|---|---|
| 0 | 9.6 | 8.7 |
| 1 | 18.3 | 10.7 |
| 2 | 29.0 | 18.2 |
| 3 | 47.2 | 23.9 |
| 4 | 71.1 | 48.0 |
| 5 | 119.1 | 55.5 |
| 6 | 174.6 | 82.7 |
| 7 | 257.3 |
delta(Pn) = Pn+1 - Pn = k*Pn(capacity - Pn)
After puting the values from table we can solve the equation for capacity of 665 to get value of k. it comes out to be 0.00082
Pn+1 - Pn = 0.00082*Pn(665 - Pn)
Now we can write python program to actually find out values.
massdata = yeast_mass(20)
saveplot(massdata)
/tmp/ipykernel_5422/3371913838.py:20: UserWarning: No artists with labels found to put in legend. Note that artists whose label start with an underscore are ignored when legend() is called with no argument.
ax.legend()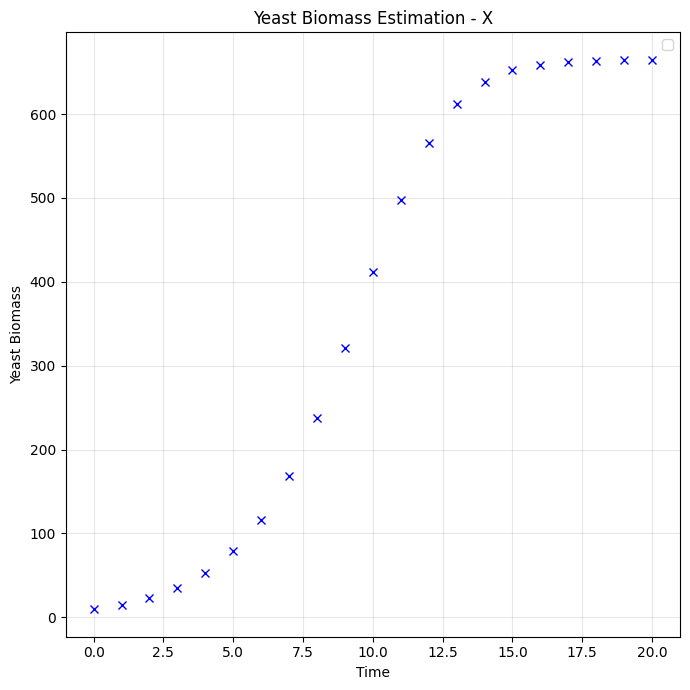
plt.plot(massdata)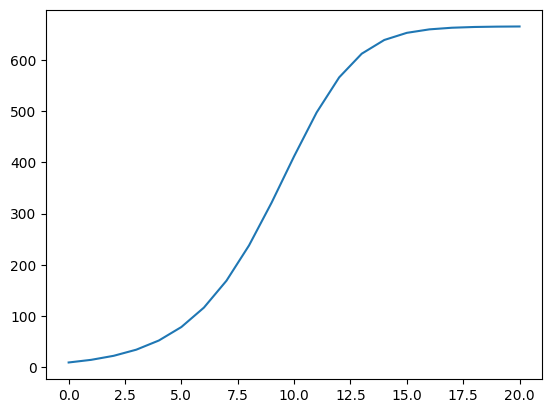
a, b = 2, 3A = (5, 8)x, y = Ax5y8import numpy as npnp.linspace(0.,10, 11)array([ 0., 1., 2., 3., 4., 5., 6., 7., 8., 9., 10.])